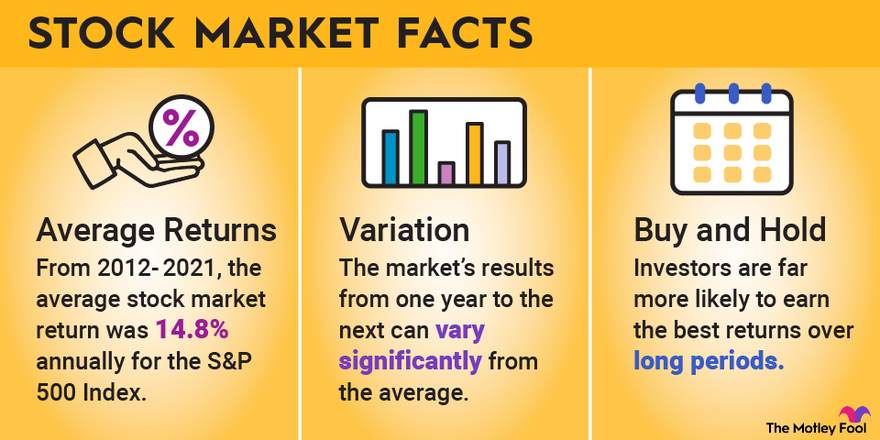
Despite the appearance of a few bear markets, the past decade has still been great for stocks. From 2012 through 2021, the average stock market return was 14.8% annually for the S&P 500 index (SNPINDEX:^GSPC), despite the infamous 33-day bear market of 2020.
Even though another bear market emerged in January 2022 and ended in October 2022 (when the S&P 500 hit its low point for the year), looking over the past decade from 2014-24 you still get an average stock market return of 13.45% annually. That's a total return of more than 250% in the trailing-10-year period.
The returns can -- and do -- vary wildly from one year to the next, and an "average" year almost never actually generates the average return. The catch? Nobody knows which years will be above or below average. This is where the one-year average is helpful only in setting the stage for stocks as good long-term investments.
Average returns
Average stock market returns
In general, when people say "the stock market," they mean the S&P 500 index. The S&P 500 is a collection -- referred to as a stock market index -- of just more than 500 of the largest publicly traded U.S. companies. (The list is updated every quarter with major changes annually.) While there are thousands more stocks trading on U.S. stock exchanges, the S&P 500 comprises about 80% of the entire stock market value on its own, making it a useful proxy for the performance of the stock market as a whole.
Returns
The market's results from one year to the next can vary significantly from the average. Let's use the 2012-21 period as an example:
- Down 4.4%: 1 year.
- Up 2% or less: 1 year.
- Up more than 20%: 4 years.
- Up between 12% and 19%: 4 years.
To put it another way, six of those 10 years resulted in outcomes that were very different from the 14.8% annualized average return during that decade. Of those six very different years, two generated significantly lower returns (with one year, 2018, resulting in losses), while four years delivered substantially higher returns. Two of those years -- 2013 and 2019 -- generated returns of more than 30%, helping to make up for the years that saw below-average returns.
10, 30, & 50-year returns
10-year, 30-year, and 50-year average stock market returns
Let's take a look at the stock market's average annualized returns (adjusting for inflation) over the following 10, 30, and 50-year time frames, using the S&P 500 as our proxy for the market.
| Period | Average Return (Including dividends) | Annualized Return (Adjusted for inflation) | $1 Becomes... (Adjusted for inflation) |
|---|---|---|---|
| 10 years (2013-23) | 12% | 10.83% | $3.10 |
| 30 years (1993-2023) | 9.03% | 7.46% | $9.30 |
| 50 years (1973-2023) | 8.02% | 6.43% | $23.99 |
It's worth highlighting the variance in annual returns from one year to the next vs. the average. Since 1972, here is a breakdown of the yearly results:
- Returns of 20% or more: 19 years.
- Returns between 10% and 20%: 13 years.
- Returns between 0% and 10%: nine years.
- Losses between 0% and 10%: four years.
- Losses between 10% and 20%: two years.
- Losses of more than 20%: three years.
Returns vs. inflation
Stock market returns vs. inflation
In addition to showing the average returns, the table above also shows useful information on stock returns adjusted for inflation. For example, let's say you invested $100 in the S&P 500 at the beginning of 1973.
You would have about $18,940.81 at the end of 2024 if you reinvested all dividends -- a return on investment of 18,840.81%, or 10.74% per year.
Now, if you're looking at an inflation-adjusted return, that's approximately 2,567.20% cumulatively, or 6.59% per year.
Related investing topics
Buy-and-hold investing
Buy-and-hold investing
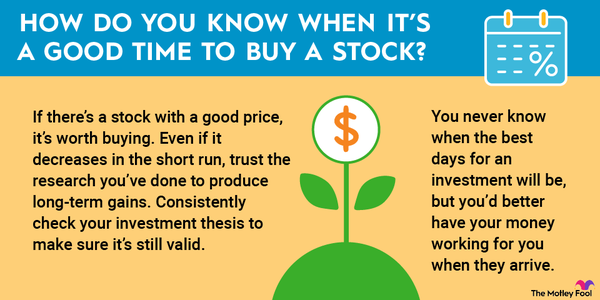
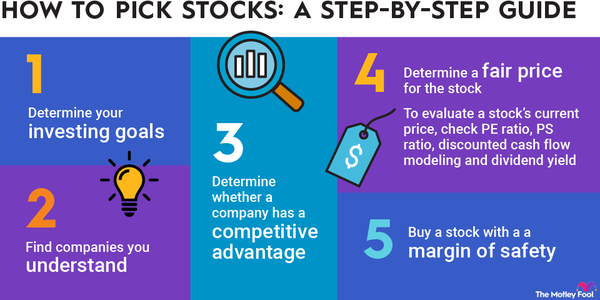
If there's any one lesson we can take from the breakdown of annual results vs. the average, it's that investors are far more likely to earn the best returns by investing for the long term. There's simply no reliably accurate way to predict which years will be the good years and which years will underperform or even lead to losses.
But we do know that, historically, the stock market has gone up more years than it has gone down. The S&P 500 has gained value in approximately 40 of the past 50 years, generating an average annualized return of 9.4%. Despite that, only a handful of years actually came within a few percentage points of the actual average. For far more years, it significantly either underperformed or outperformed the average than were close to the average.
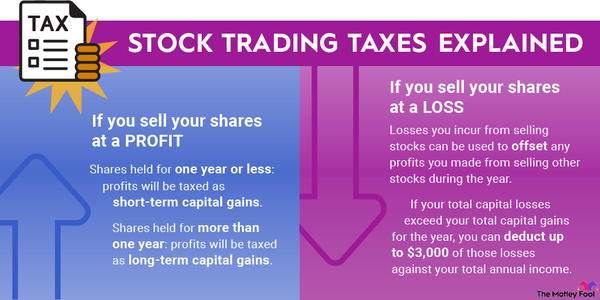
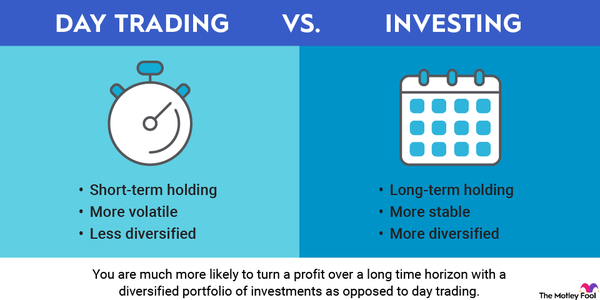
What's a person to do? Buy high-quality stocks, ideally regularly across every market condition, and hold those investments for many years. The evidence is overwhelming that investors who try to trade their way to higher returns with short-term moves or who buy and sell based on projections of short-term peaks and bottoms generally earn below-average returns. Moreover, those strategies require substantially more time and effort. They can also result in higher fees and taxes that further reduce gains.
If you're looking to build wealth, investing in stocks is an excellent place to start. But to get the best returns in stock investing, use the method that's tried and true: Buy great stocks and hold them for as long as possible.